
One Chokepoint Controls Everything. Building a God's Eye View of the Hormuz Crisis.
How Open-Source Intelligence Could Reveal What's Coming Next.

A few weeks ago, I built a 4D reconstruction of Operation Epic Fury -- the Iran strikes, visualized on a 3D globe using satellites, flight data, and open-source intelligence. The internet lost its mind.
Since then, the crisis moved to the water.
The Strait of Hormuz is 21 miles wide. Some of the vessels that transit it are longer than the Empire State Building is tall. On a normal day, 130 ships squeeze through carrying a fifth of the world’s oil. Right now, almost nothing is getting through. Iran has effectively shut down the most important waterway on Earth.
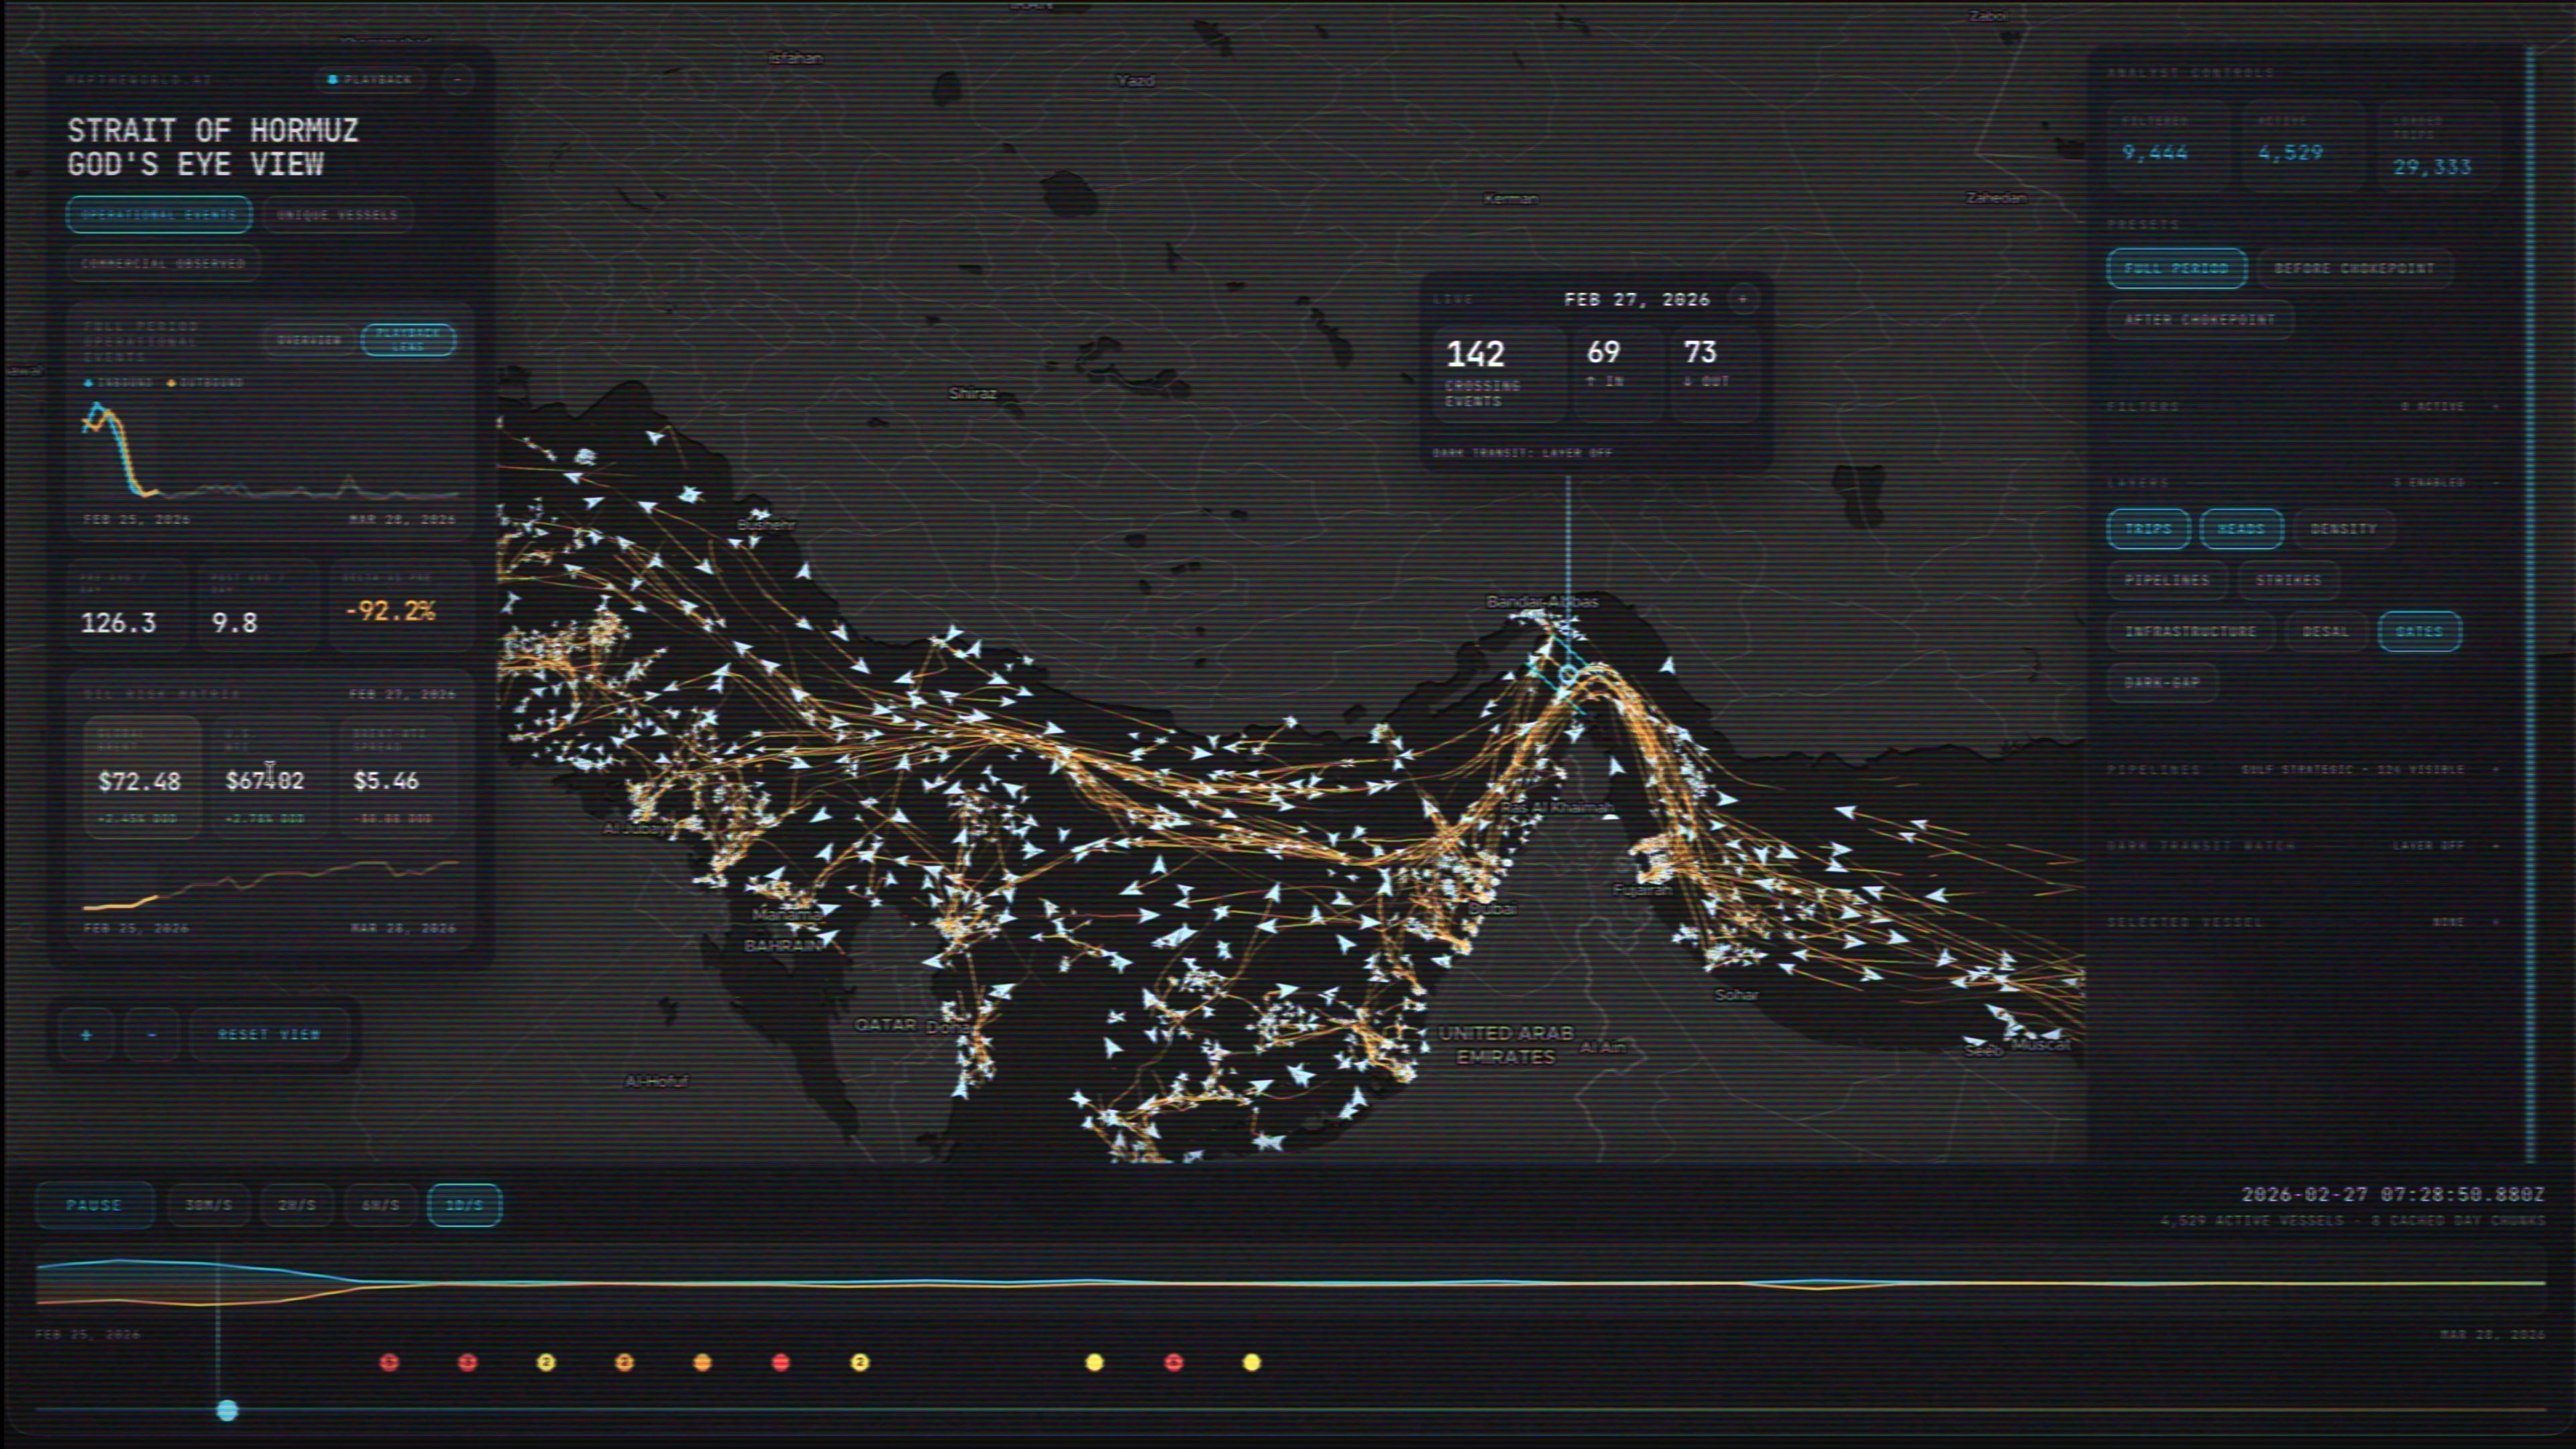
So I retooled God’s Eye to follow it -- swapped the flight transponders and satellite passes for maritime AIS beacons, every vessel broadcasting its position, heading, speed, and flag state through that narrow passage.
That’s the thing about open-source intelligence. The data layer for almost everything is just... out there. Flights, satellites, GPS interference, shipping -- different feeds, same principle. Fuse them together on a timeline and a globe, and you start seeing things you probably shouldn’t be able to see.
I’ve been recording since February 25th. The video breaks it all down visually. But there’s more in the data than I could fit in 15 minutes, and some of it is pretty alarming.
Watch the full video here:
What The Data Actually Shows
Before the strait closed, traffic was robust -- 130 crossing events per day on average. Ships stream through this narrow passageway around the clock.
Then Operation Epic Fury goes down. And suddenly we’re at single digits. Some days, zero.
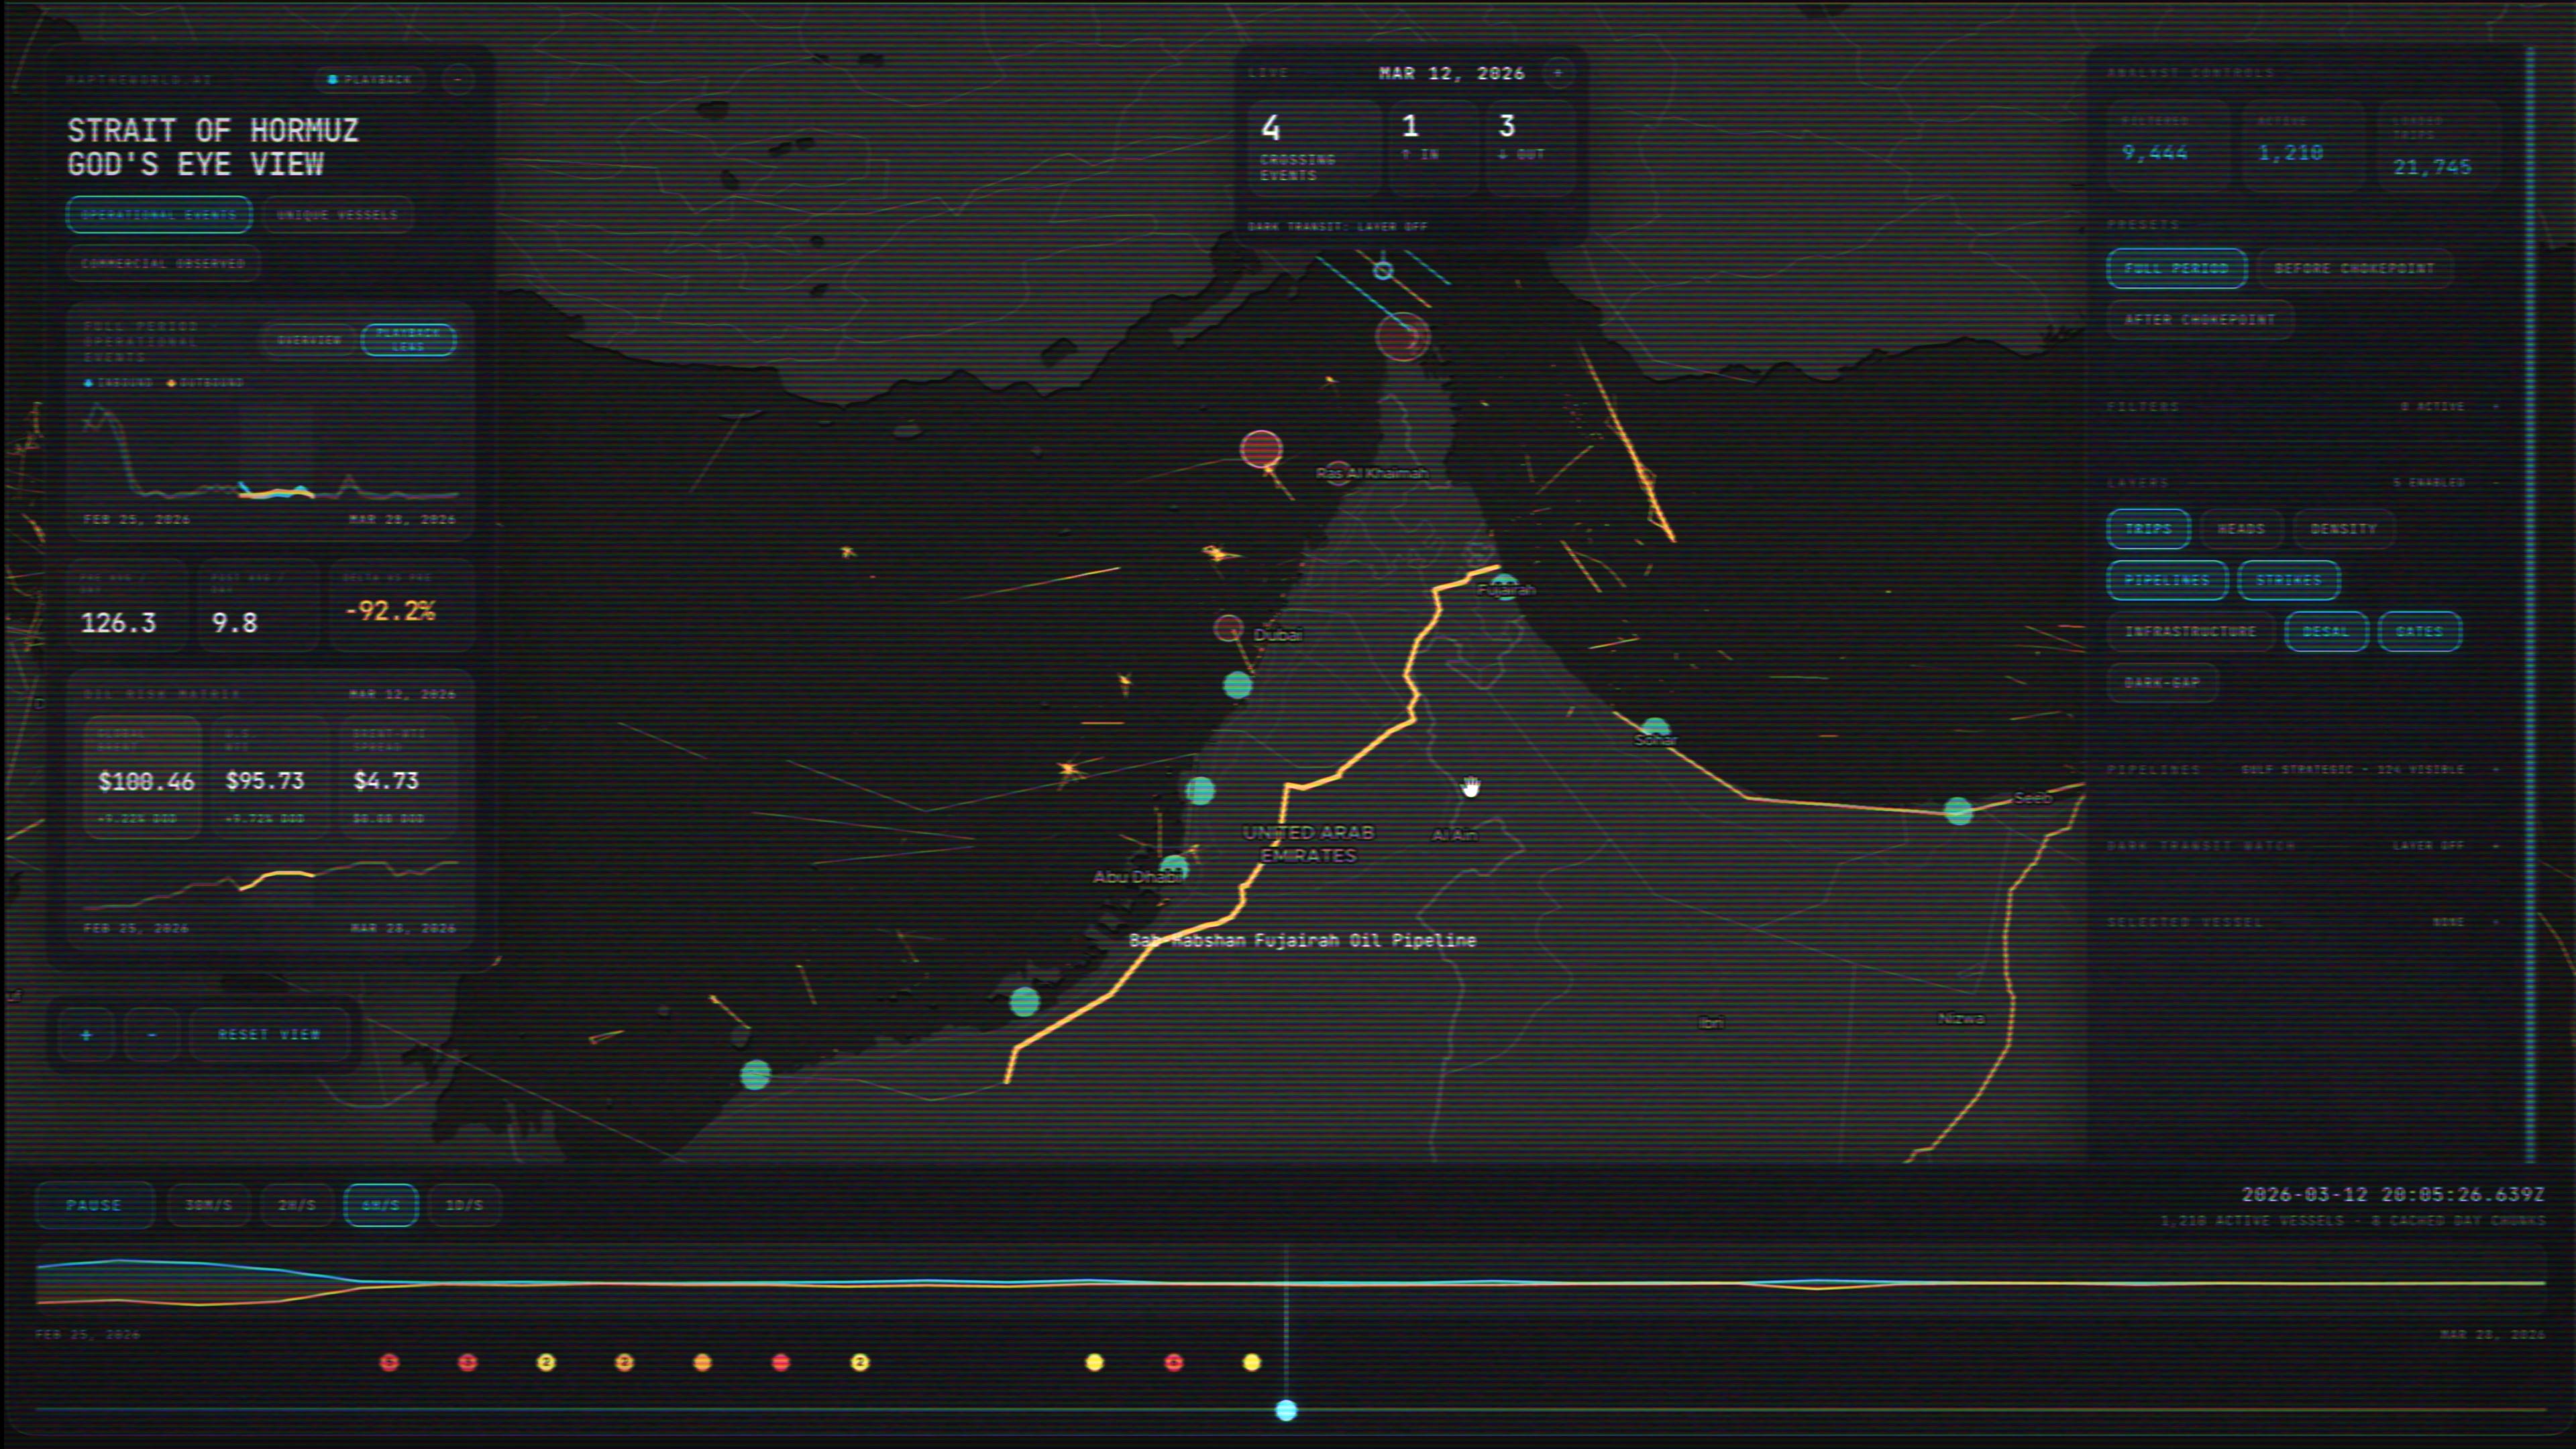
A 92% drop.
If you pull back and watch the time-lapse, it’s eerie. Dozens of massive tankers just... parked in the open ocean. Literal parking structures in the middle of the water, waiting for their moment to get out of dodge.
The inbound and outbound traffic lines tell the whole story. Pre-crisis average: about 130 crossings per day. Post-crisis: about 10. Choke out a fifth of the world’s oil supply and you start hearing about it everywhere -- South Korea declared a state of emergency, Pakistan is rationing fuel.
The Toll Booth
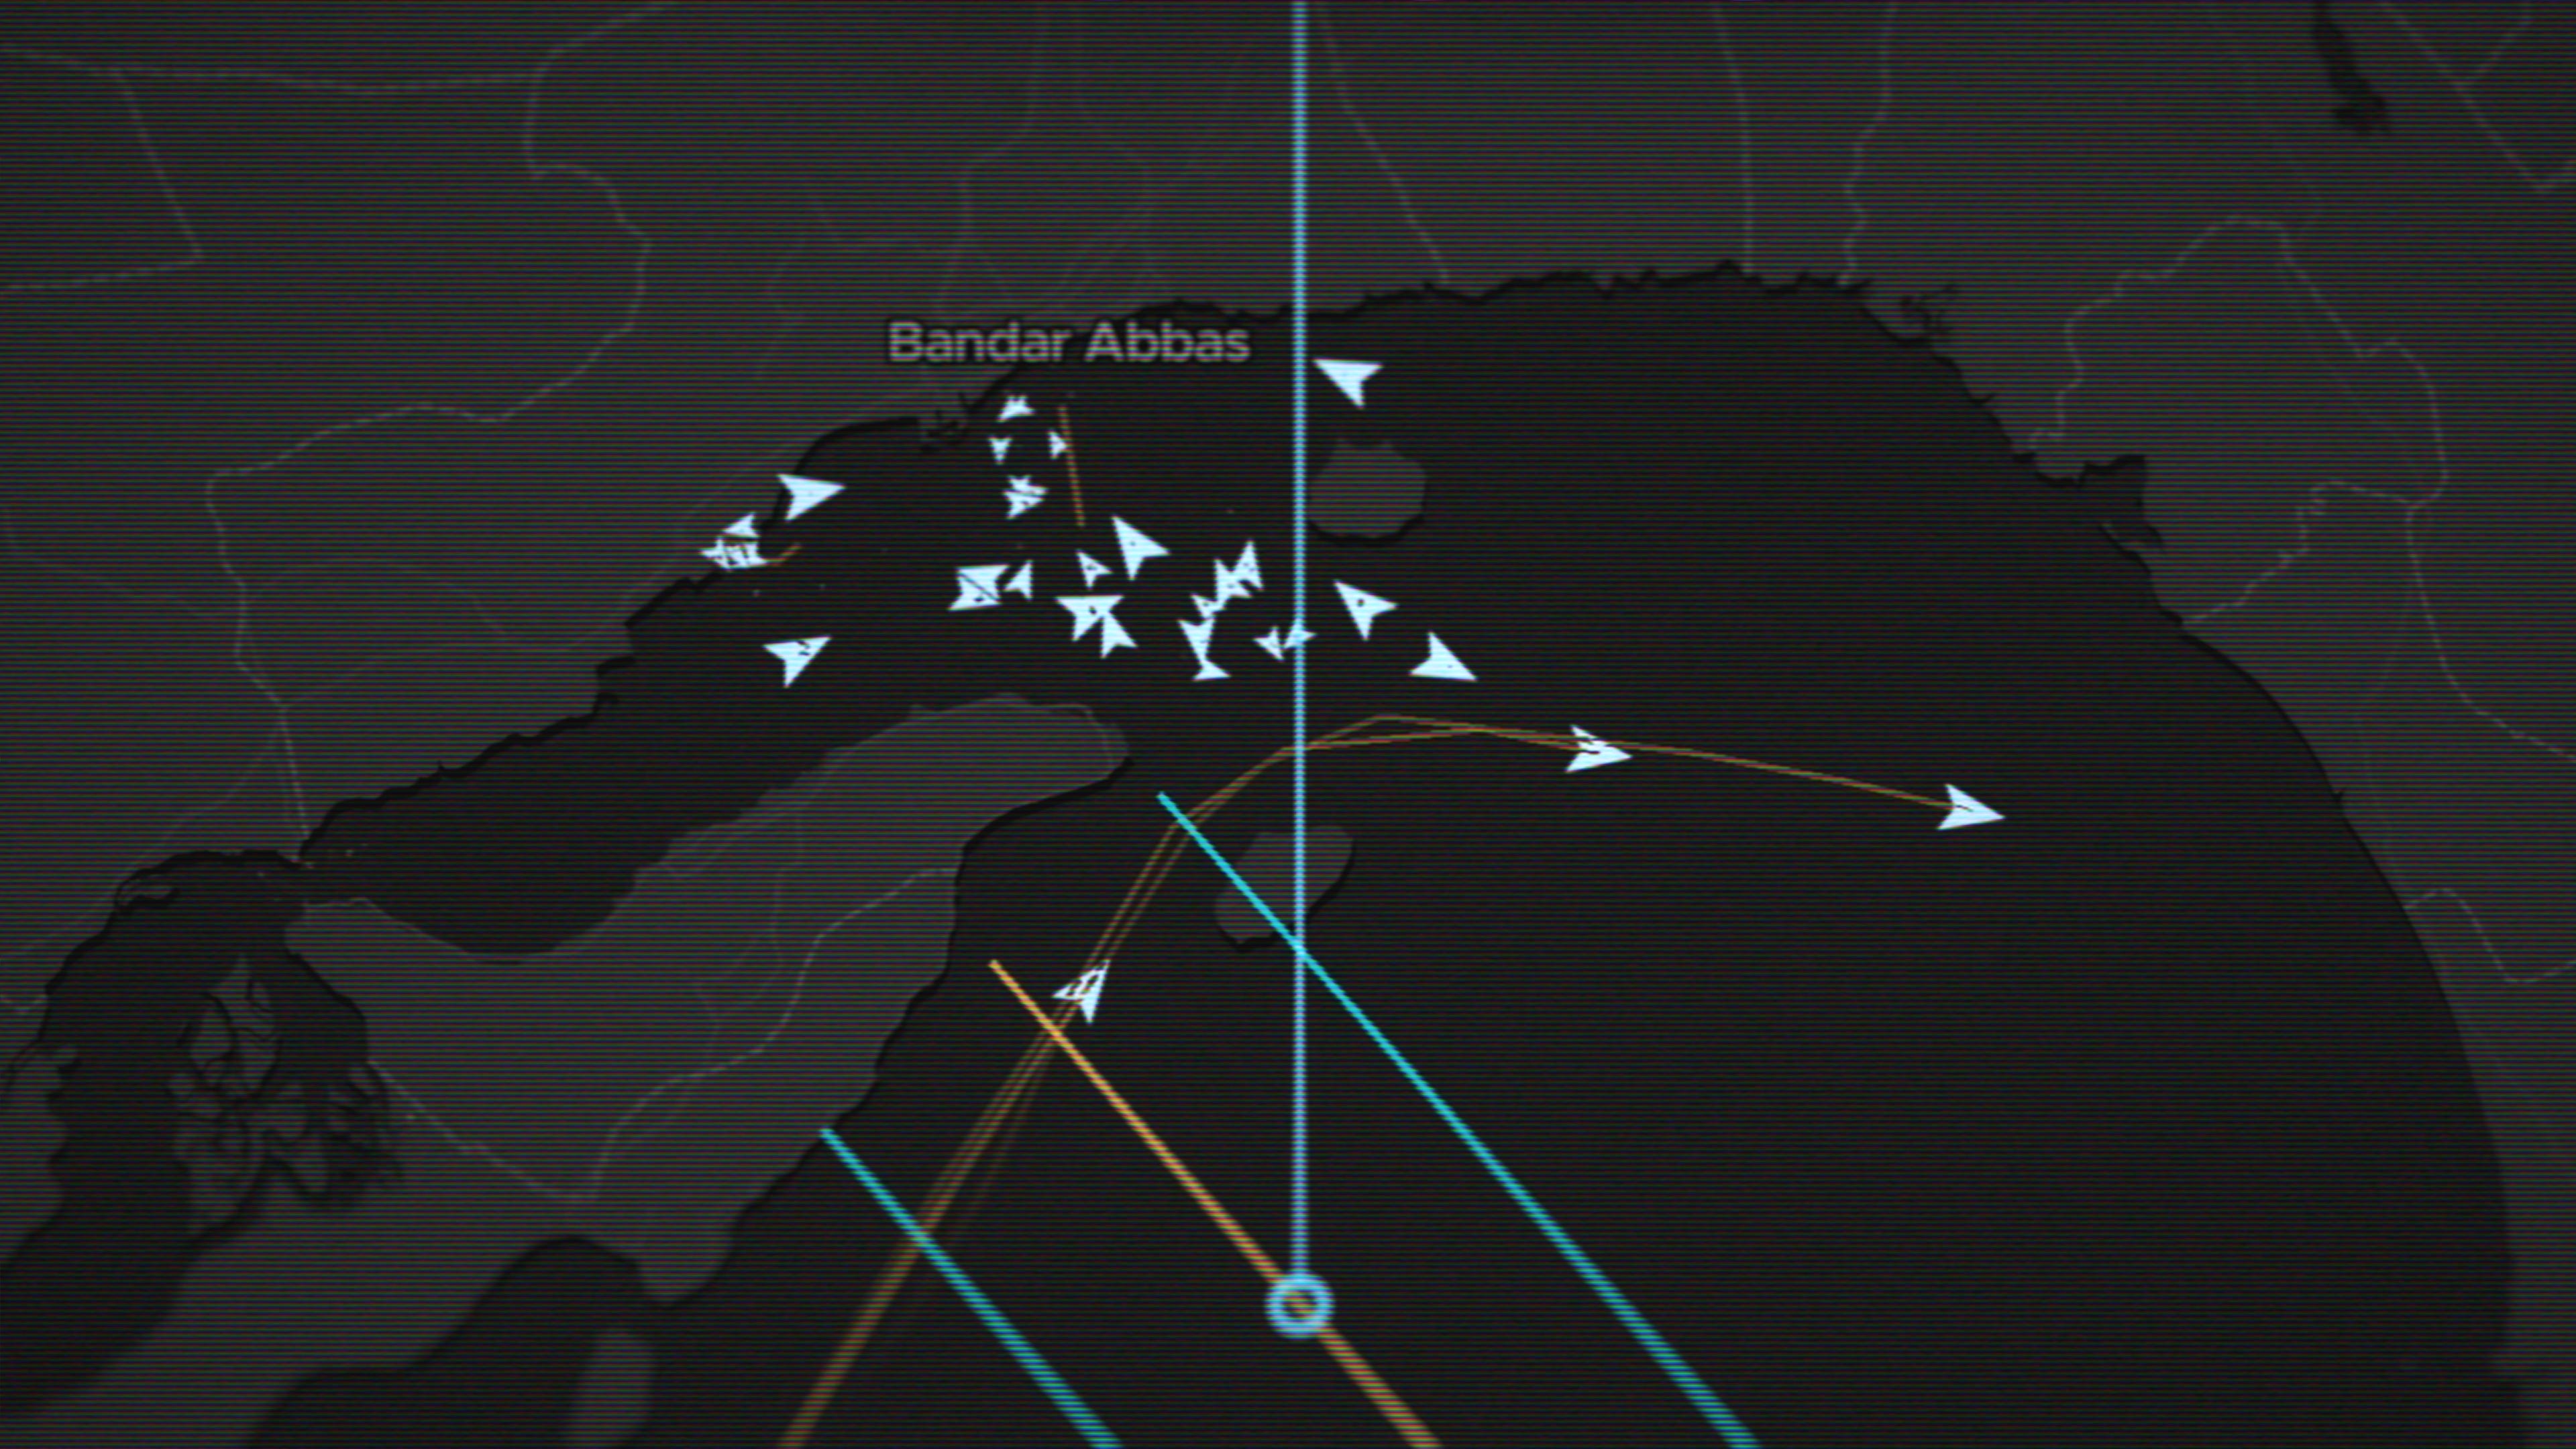
So here’s where it gets interesting. The ships that are making it through aren’t taking the normal route. The main transit lane through the deepest part of the strait? Completely empty. Instead, the handful of vessels getting through are hugging the northern coastline -- right up against Iran.
What’s been reported is that Iran has effectively set up a toll booth. Make a deal with us, we’ll let you through, and you get an IRGC escort for the privilege.
The price? Reports say $1 to $2 per barrel. These tankers carry two to three million barrels. So we’re talking $2 to $6 million per ship, per transit. Iran is making a killing -- literally formalizing the process.
Look at the ships that are getting through and you start seeing the pattern. India-flagged LPG tankers. Pakistan-flagged crude oil carriers. Bolivia. Liberia. Comoros-flagged vessels, where god knows who the actual owner is. Countries that are so dependent on petrochemicals that they don’t have a choice.
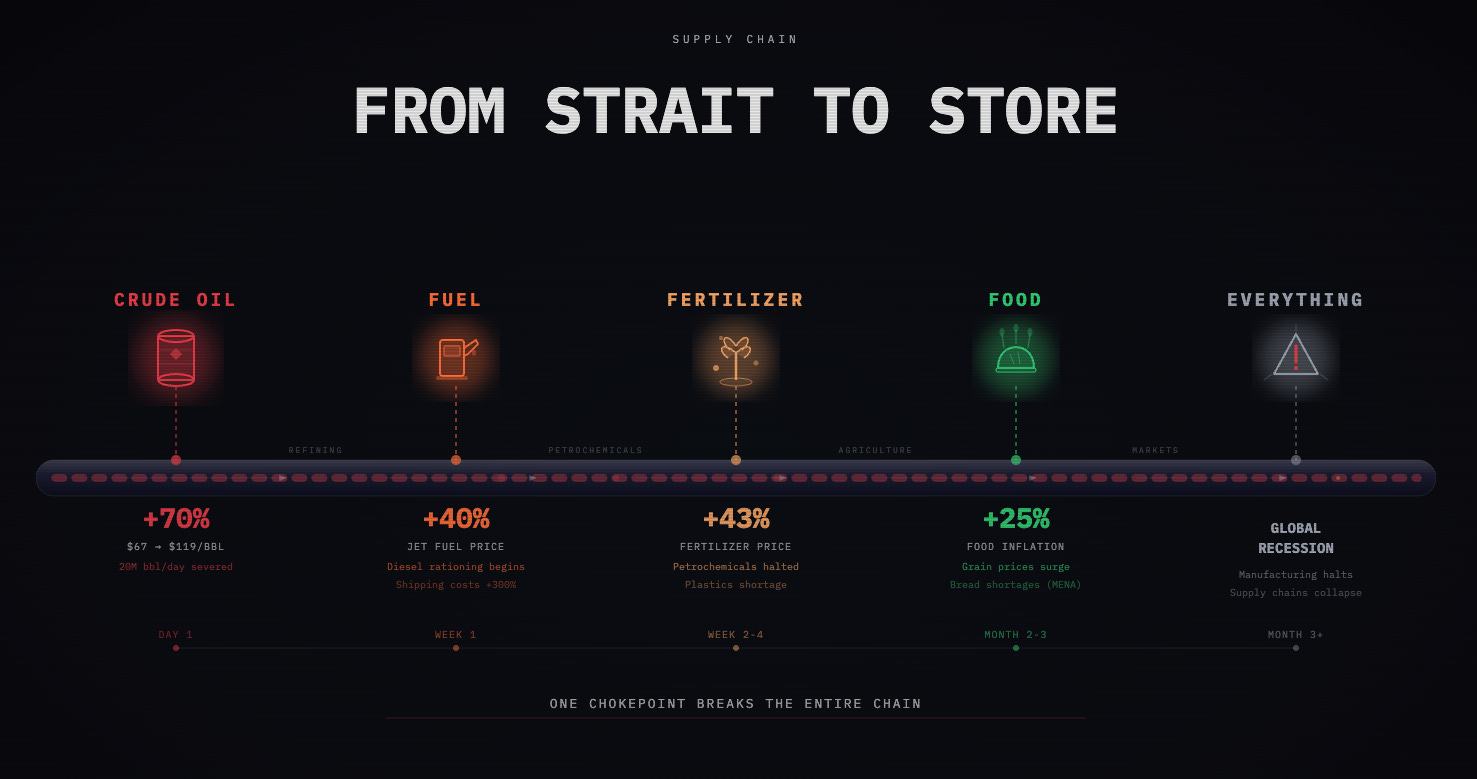
And this matters beyond just energy. Crude oil is obvious -- fuel. But the byproducts, the petrochemicals, are responsible for fertilizer production. Which means this isn’t just about your commute getting more expensive. It’s about whether countries can feed themselves.
Dark Vessels
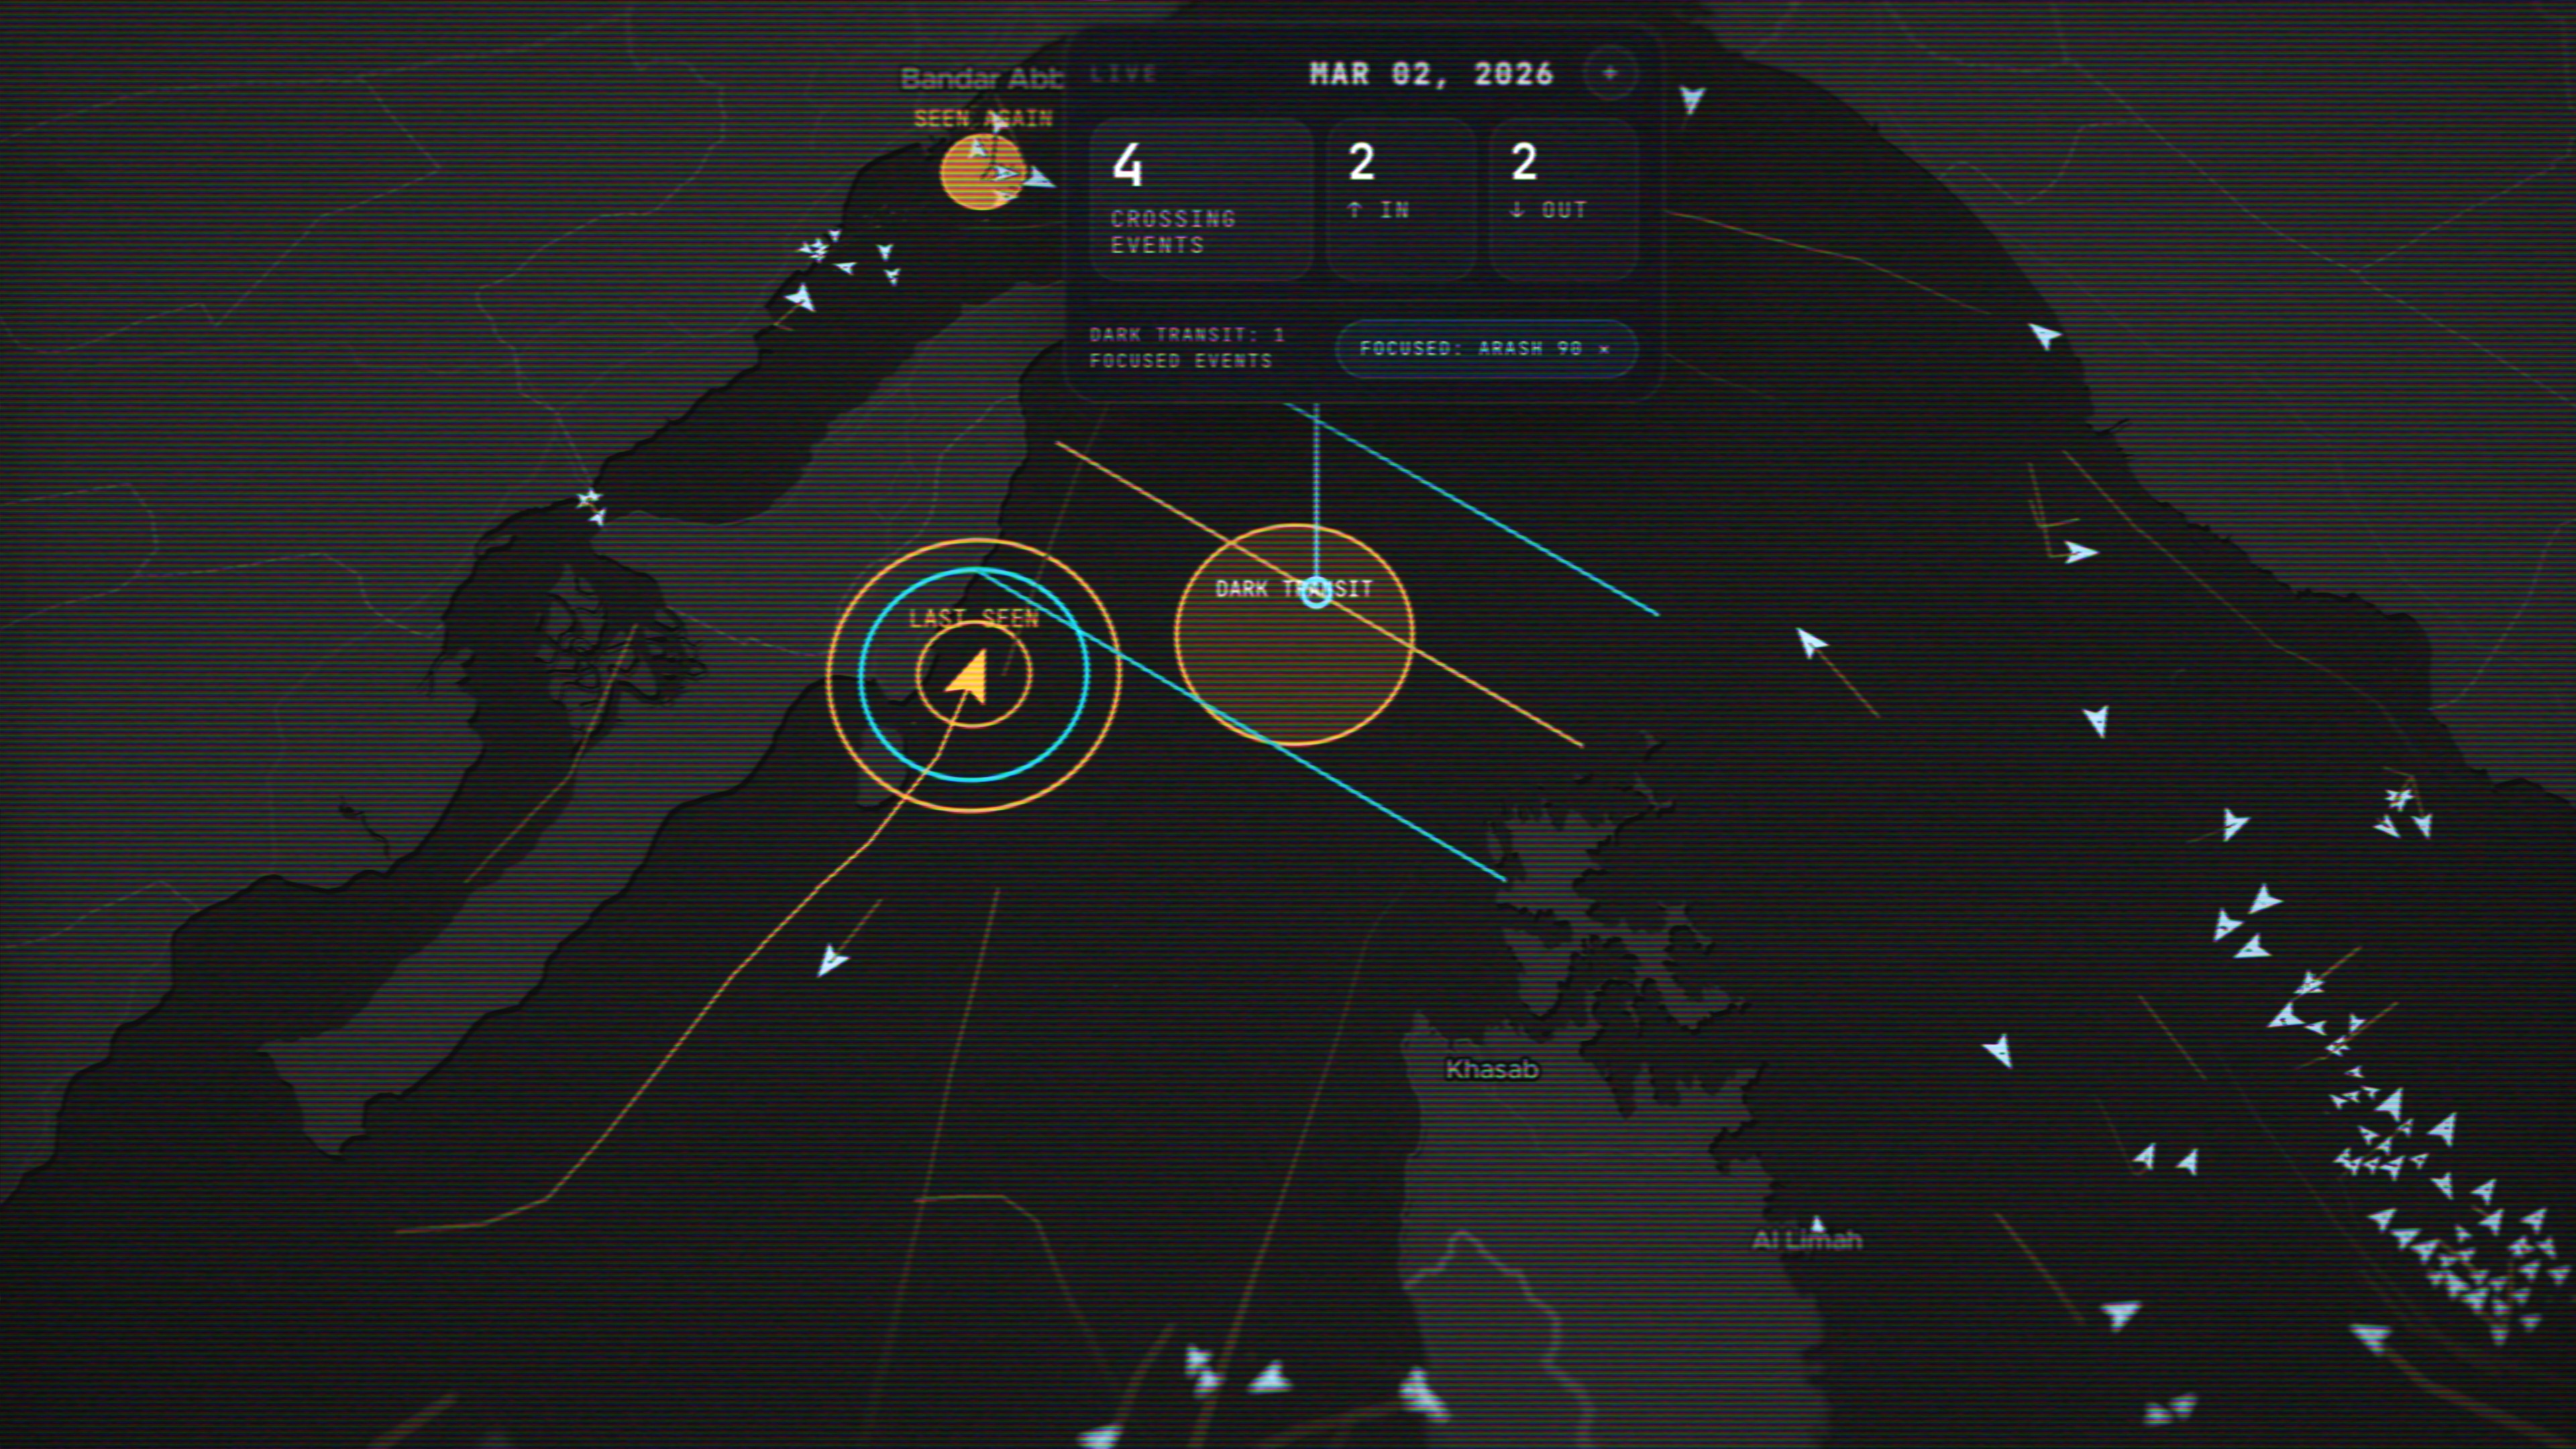
Here’s where it gets really wild. A bunch of ships are turning off their AIS transponders right as they transit the strait.
AIS -- Automatic Identification System -- is basically the ship equivalent of a flight transponder. Every commercial vessel broadcasts its position, heading, and speed. When you have all this data, you can spot the gaps.
Take the Jag Vasant, an India-flagged LPG carrier. On the 23rd, you can watch it mosey on over toward the strait, and then right as it’s about to cross -- the signal disappears. Dashed line. Dark transit. Probably getting an IRGC escort. Then when it’s safely through, the signal pops back on.
This pattern repeats over and over. Iranian cargo vessels doing it. Comoros-flagged carriers doing it. Ships going dark for the crossing, then reappearing on the other side like nothing happened.
And then there’s the metadata. Some ships are transmitting AIS messages that read “ALL MUSLIMS ON BOARD” or “ALL CHINESE” or “NO IL LINK” -- trying to signal their way out of getting blown to smithereens.
Think about how low-end that feels. You’re a massive oil tanker worth hundreds of millions of dollars, and your survival strategy is transmitting a text message over a decades-old transponder protocol.
The Bypass
So if only a handful of ships are making it through the strait, how does oil get out of the Gulf?
Pipelines.
Saudi Arabia has the East-West crude oil pipeline that runs across the entire desert to the port of Yanbu on the Red Sea. Saudi Aramco built this thing for exactly this scenario. The UAE has the Habshan-Fujairah pipeline -- built specifically so that if Iran ever holds the strait hostage, they can route around it.
These pipelines are currently handling about 42% of normal flow. They’re the reason oil prices haven’t gone completely to the moon.
But here’s the problem: Iran knows about every single one of them. And some of those strikes? They’ve been landing right on Yanbu. Iran is sending a message.
The UAE pipeline? Same thing. Iran wants them to know that the bypass has a target on it.
And if things escalate further -- if Iran mobilizes the Houthis to start targeting ships on the Red Sea side, the side where Yanbu exports its oil -- then the bypass routes get choked too. At that point, we are absolutely screwed.
Here’s the thing about chokepoints though -- they’re connected. The Strait of Hormuz connects to the Gulf of Oman, which connects to the Arabian Sea. The Red Sea connects to the Suez Canal. Close one and the pressure moves to the next. The global economy is just fluid flowing through pipes, and someone’s squeezing.
The Escalation Ladder
The strike map is insane when you see it all at once on the globe. But what matters more than the individual hits is what each one was saying.
The initial US-Israel strikes went after Iran’s nuclear and command-and-control capacity -- Natanz, aerospace complexes, and underground missile bases. Basically saying: we can reach your most protected stuff.
Iran didn’t hit back symmetrically. They went after a power and water station in Kuwait and facilities in Qatar. They didn’t touch the US or Israel directly. They made their friends’ lives miserable instead.
By March 7th, Israel and the US hit refineries -- Shahran oil depot, Tehran refinery. Apocalyptic walls of fire. Iran retaliates at the Sitra refinery complex in Bahrain. Operations halted.
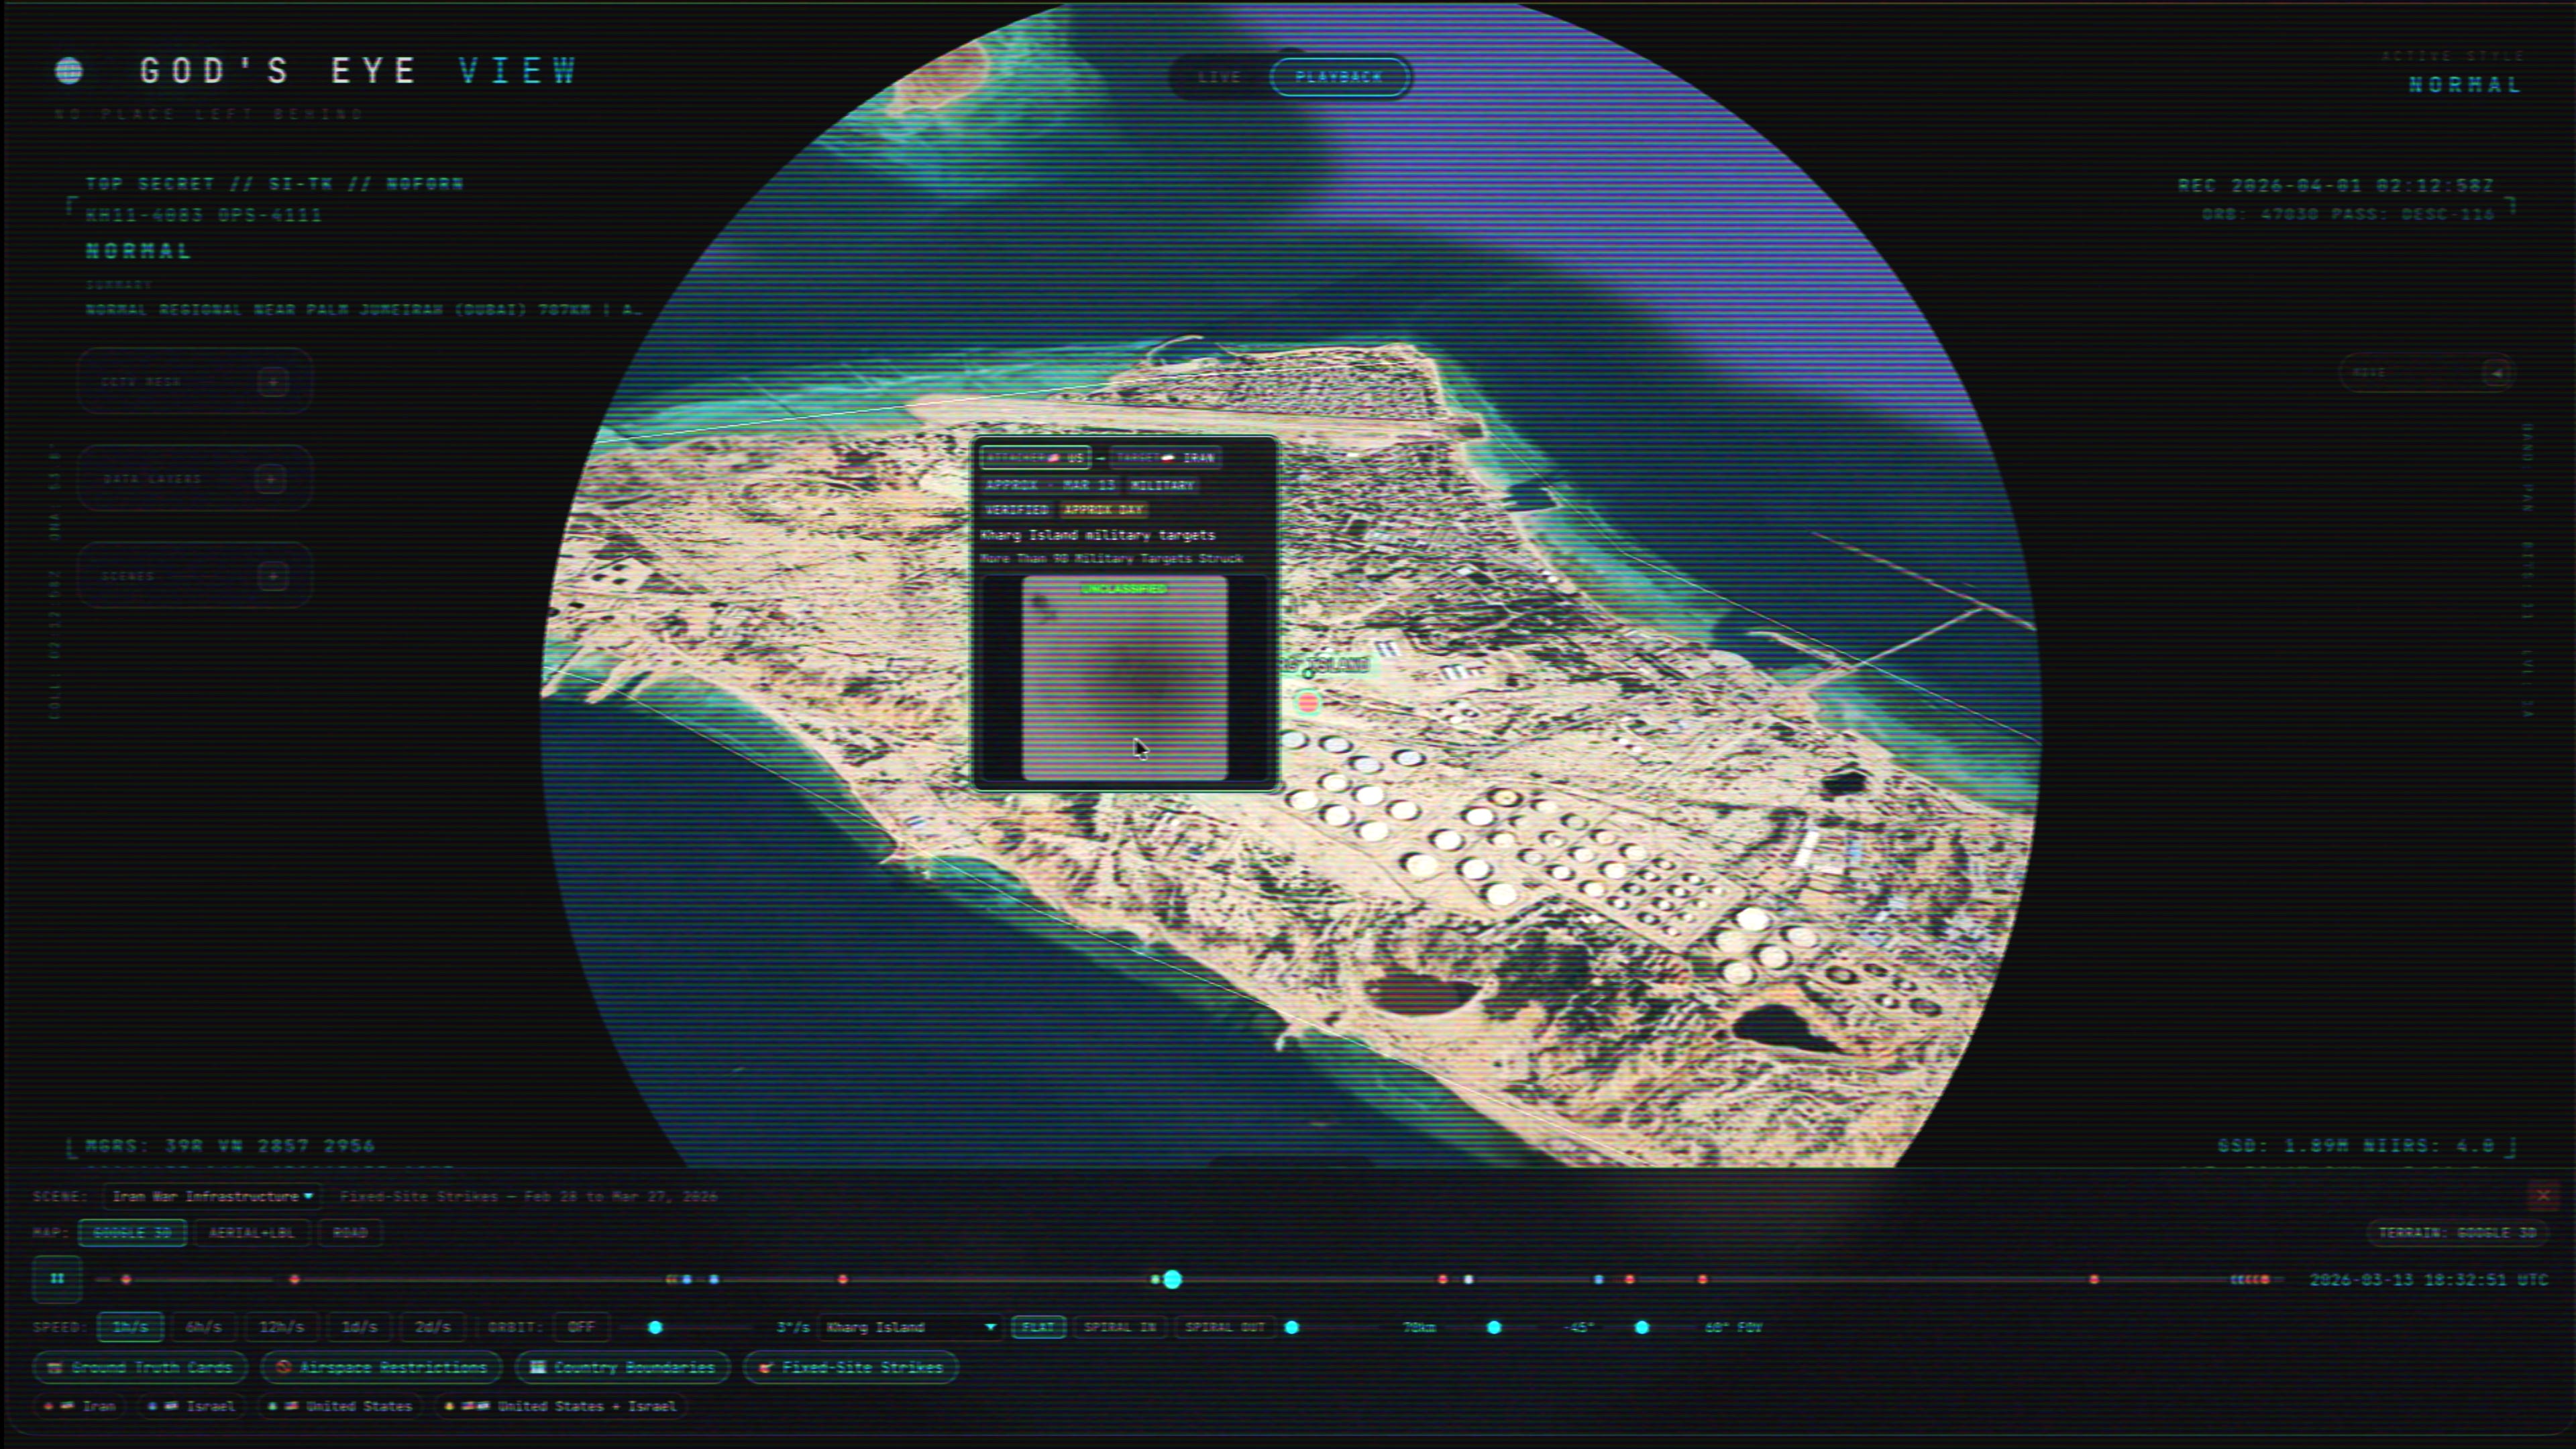
March 13th -- Kharg Island. 90 targets. When you look at it on the map, it genuinely looks like a battlefield, and was quite literally a map in the video game battlefield 3.

And throughout all of this, ships in the Gulf are getting hit. The Skylight -- struck by a projectile, twenty crew evacuated and four injured. The MKD VYOM -- hit the same day by a remotely operated boat, leaving one Indian crew member dead. The Stena Imperative -- first US-flagged vessel attacked, hit by two missiles while docked in Bahrain. The Mayuree Naree, entire superstructure engulfed in flames in the Strait itself, three crew missing. Ship after ship after ship.
Both sides are still showing remarkable restraint, though. Nobody has outright bombed a pipeline, because that would be a point of no return. But the strikes keep landing on infrastructure that gets closer and closer to the line.
And for anyone thinking a ground campaign is the answer -- look at Iran’s terrain. Mountains everywhere. This isn’t Iraq’s flat desert. Anyone who thinks ground operations in Iran look like anything we’ve done before hasn’t looked at a topographic map.
The Ripple Effect
Zoom out and the global picture gets scary fast.
Brent crude went from $70 a barrel to over $110. The US strategic reserves initially absorbed the shock -- prices lagged behind the rest of the world for the first couple of weeks. But that buffer is eroding fast. The national average just crossed $4 a gallon for the first time since 2022, up over a dollar in a single month. California diesel is pushing past $7. And it’s still climbing.
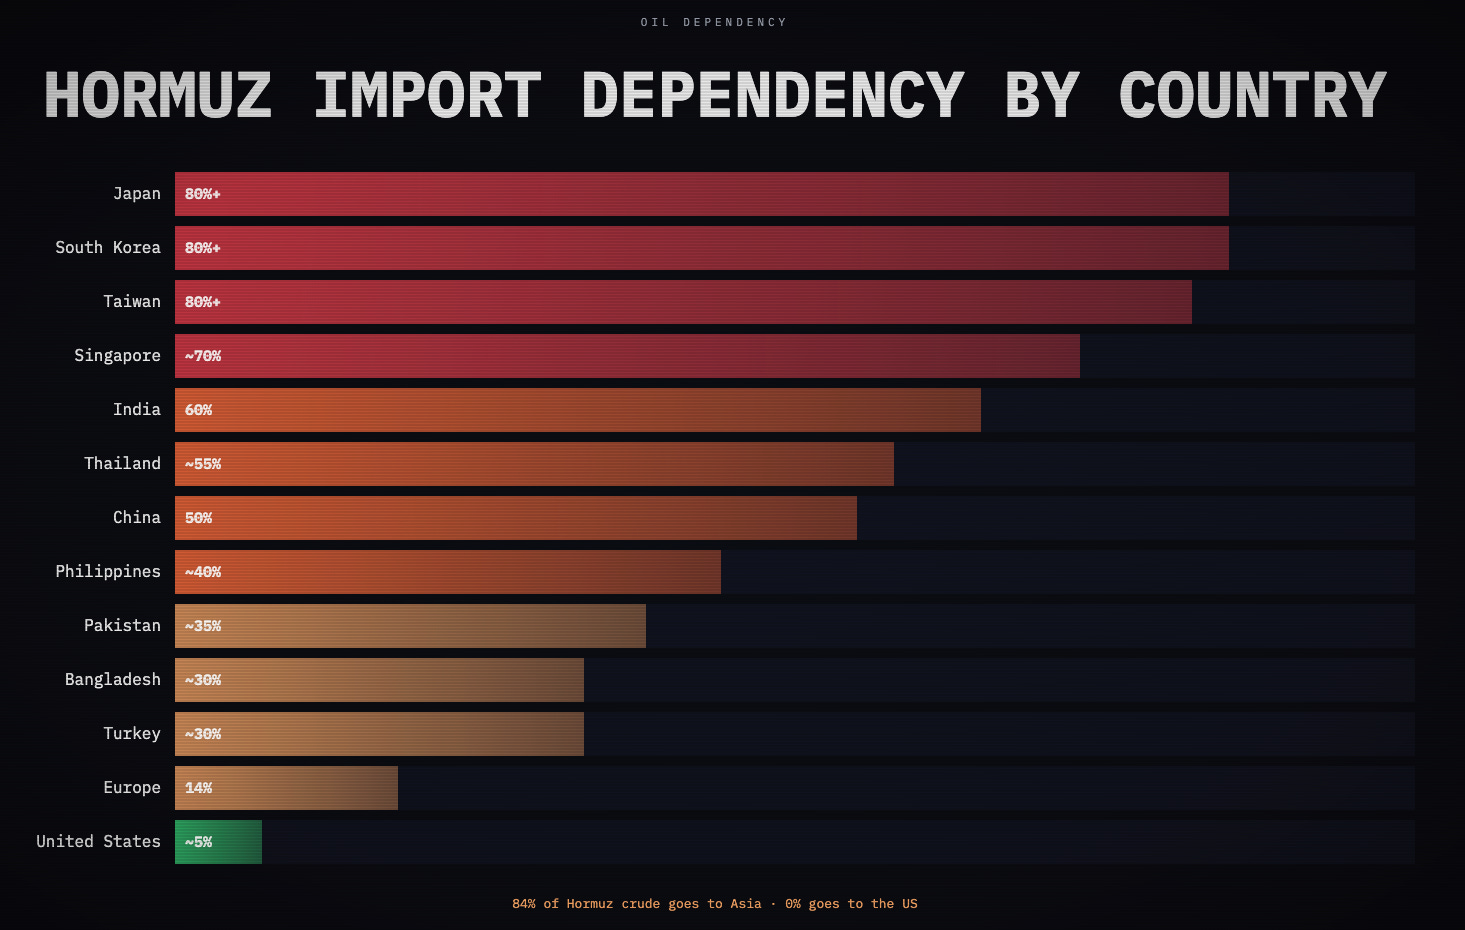
Now look at who’s really exposed -- the countries that import the majority of their oil through the Strait of Hormuz:
Japan: 80%+
South Korea: 80%+
Taiwan: 80%+
Singapore: ~70%
India: 60%+
And strategic reserves -- how long each country can survive without that Hormuz import:
Pakistan: 10 days
India: 22 days
Singapore: 78 days
South Korea: 91 days
China: 173 days
Japan: 174 days
US: 400+ days
Europe: 400+ days
Pakistan has ten days. India has three weeks. The US is chilling with over a year. The asymmetry is staggering.
The downstream effects are already hitting. The Philippines ordered a four-day work week to cut fuel consumption. Egypt is closing shops by 9 PM to reduce power usage. Bangladesh closed its universities early -- so students don’t have to commute. Fuel rationing across Africa. Fertilizer prices are up 40%.
The Department of Energy is projecting things won’t normalize until 2027.
And here’s the thing people miss -- when oil gets expensive, everything gets expensive. Oil isn’t just fuel. It’s plastics. It’s fertilizer. It’s the supply chain that moves every physical product on Earth. One 21-mile chokepoint can cascade into food inflation, which cascades into a global recession.
We can talk about green energy all day, but our civilization as it stands is exceedingly dependent on petrochemicals.
The EIA projects the shock will persist through the summer, keeping Brent crude above $95 for the next two months before dropping below $80 in the third quarter. They expect prices to fully cool to around $64 a barrel in 2027.
Why I Keep Building God’s Eye
We consume so much information about this crisis -- tweets, news reports, hot takes. But you can’t internalize what’s actually happening until you combine all the sources and visualize them at once on a globe.
The shipping collapse. The dark transits. The pipeline bypasses getting targeted. The tit-for-tat strikes escalating. The oil futures climbing. The reserves depleting. Each of these is a headline on its own. Together, on the same map, on the same timeline, they become understanding.
You start to actually grasp what it means when someone says “the Strait of Hormuz is closed.” It means a billion people have three weeks of oil left. It means Pakistan’s strategic reserve wouldn’t last two weeks. It means the bypass pipelines are being targeted too, and that there’s no clean exit.
First it was flights, satellites, GPS jamming, and no-fly zones. Now it’s shipping lanes, dark transits, and oil pipelines. The data layer keeps expanding. The principle stays the same: fuse every public source together and the whole becomes dramatically greater than the sum of its parts. That’s the value of spatial intelligence. Data stops being abstract and starts being geographic, temporal, physical.
I’m heading to TED in Vancouver on April 13th -- curating sessions with robots, drones, OpenClaw, Reddit, and a bunch of incredible people. Once that’s done, my entire focus goes back to making God’s Eye View the most complete model of reality you can actually get your hands on.
Previous WorldView videos:
If this gave you something to think about, share it with someone who should see it. This affects all of us.
-Bilawal
I’m chomping at the bit to get my hands on this. My own recreations are not even close! The visualisation is the hardest part for me, but this is just so much better than I ever imagined I’d have access to not so long ago. we live in a data rich world thats for sure
that's some pretty cool stuff, we actually built this satellite (a whole wack of people) https://ottawacitizen.com/news/national/defence-watch/radarsat-constellation-to-track-ships-provide-surveillance-over-arctic-and-other-regions which has the potential to detect rogue ships with their AIS turned off. I suspect you are tapping into this data? https://www.marinetraffic.com/
Oil is so so critical in so many ways watch planet oil part I and II how to overthrow government
https://www.dailymotion.com/video/x2lvzns . https://www.dailymotion.com/video/x2lwbv4 . https://foreignpolicy.com/2017/06/20/64-years-later-cia-finally-releases-details-of-iranian-coup-iran-tehran-oil/ . https://en.wikipedia.org/wiki/Iran%E2%80%93United_States_relations_during_the_George_W._Bush_administration . https://www.aljazeera.com/news/2020/6/29/iran-and-us-president-donald-trump-a-timeline-of-key-events etc... never ending it seems till we ween ourselves off the dirty stuff.
we have been here before and we will do it again for those that control the oil control your every movement those that own the debt own your soul https://www.investopedia.com/articles/investing/081315/opec-vs-us-who-controls-oil-prices.asp I worked in resources for over a decade in satellite technology primarily. Plus defense and national policing etc..stuff I have seen incredible but that's another story.
Now what would be cool to know is how much oil is really left in the middle east? https://www.worldometers.info/oil/ how much has to be pushed out with polymers or with water now as its more costlier to get at as we dig deeper, go way out to sea etc... this guy has some good books on it all https://www.ctvnews.ca/calgary/article/economist-jeff-rubin-offers-a-map-of-the-new-normal/ . https://www.youtube.com/watch?v=r0NwC8vSSeE
what are the throughputs at those wells? https://globalenergymonitor.org/projects/global-oil-gas-extraction-tracker/tracker-map/ that would be hugely beneficial to know. Two things are very critical now how fast they can pump that oil and get to where it is needed as the USA blows through 20 million barrels a day china 15M who will win the oil war? https://www.eia.gov/tools/faqs/faq.php?id=709
Oil up inflation up interest rates up housing dies a huge driver to falsely prop up GDP. Can't print/borrow money nor sell the country off (bonds) now what? https://en.wikipedia.org/wiki/Oil_war . https://advisor.visualcapitalist.com/historical-oil-prices/
People don't realize how many economic elements are tied to oil from the production of goods to the movement of goods and economic variables as well such as inflation. If those oil prices go up most likely food prices and the price of goods are going up too.
The second element of importance is the debt velocity of money, where the heck does money come from anyone? https://www.youtube.com/playlist?list=PLE88E9ICdiphYjJkeeLL2O09eJoC8r7Dc its all debt velocity of money now how fast can you get debt spinning https://www.youtube.com/watch?v=DZMHG8X1QN8 . https://www.youtube.com/watch?v=8etB_ft35gU
Given those two variables - oil production and debt velocity of money could one potentially come up with very good threat prediction models of when an economy will fall apart and fault?
How much oil is being produced how much oil is being consumed and how much money is spinning in the economy as everyone wants to live big now with a mcmansion and 5 trucks in the driveway can that continue? luckily some countries are very very smart in approach now using technology and other alternative energy sources like SMRs etc... https://world-nuclear.org/information-library/nuclear-power-reactors/small-modular-reactors/small-modular-reactor-smr-global-tracker . https://investinginpassion.com/2025/11/04/how-chinas-automation-surge-is-redefining-global-manufacturing/ USA seems to be regressing? back to the 1950s? in some regards... but wants world domination? https://www.whitehouse.gov/releases/2025/09/president-trump-tech-leaders-unite-american-ai-dominance/ . https://www.intereconomics.eu/contents/year/2025/number/2/article/big-tech-and-the-us-digital-military-industrial-complex.html yet the debt mounted enormous how long can that go on till the bar tab comes due? https://www.politico.com/news/2026/02/11/us-debt-forecast-to-hit-64t-in-a-decade-as-trump-policies-widen-deficit-00775726 what's the implications of that? https://www.forbes.com/sites/dougmelville/2026/03/20/as-us-debt-passes-39-trillion-americans-are-paying-900-billion-in-interest-annually/ ouch! as a good consumer nation now buy by emotion not logic anymore.
We need better threat prediction models!!! especially from an 'economics' (meaning home) perspective what is this economy even tied to anymore https://en.wikipedia.org/wiki/Planetary_boundaries and as you add more people to an equation what are the underlying costs to it all. Luckily the population seems to be in the decline https://www.visualcapitalist.com/cp/charted-the-worlds-aging-population-1950-to-2100/ I'm sure some higher power has a kill switch on it all if we get too crazy in our ways https://www.psychologytoday.com/us/blog/evolution-of-the-self/201210/greed-the-ultimate-addiction throw a dictator in the mix https://bigthink.com/neuropsych/dictator-psychology/ to really make a mess of things
Useful and useable AI, what! its all about the data (fusion/aggregation) clean and truthful data eh!